.png)
The chances of a new B2B SaaS category crossing the chasm is 37%. And the timing of the first movers in a new B2B SaaS category is an irrelevant data point for estimating when that category will reach 'Early Majority'. Curious to find out why?
Welcome to “Math meets B2B SaaS”, where I'll be discussing:
What do waiting for a bus and crossing the chasm have in common?
How can the secretary problem be applied to fine-tuning your Ideal Customer Profile (ICP)?
What does the law of large numbers say about pipeline analysis?
How to overcome regression to the mean after a record quarter?
Math theorems are usually thought to belong in textbooks or university classes that most people don’t have fond memories of. For most, they can feel very abstract and far from being needed or applicable in real life. However, like the laws of physics, they are at play even when they go unrecognised. They can help explain and address some strategic as well as operational topics in the world of B2B SaaS. And that’s exactly what I’ll dive into in this mini series!
So, let’s tune in for “Math meets B2B SaaS”, starting with what waiting for a bus and crossing the chasm have in common, and how Poisson processes can help you think about your GTM strategy from a new perspective!
Old London buses and why you’ve always been ‘unlucky’ with your wait time
It’s a typical rainy afternoon in London in 1960… You’re waiting for your routemaster bus, keeping an eye out on the road, ready to jump on any moment as they only very briefly stop to pick up/drop off passengers. There aren’t digital screens to tell you estimated arrival times or people actively managing drivers to even out the bus service. You’ve been waiting for 5 minutes now. You start thinking, since this bus runs every 10 minutes, and you’ve already waited the supposed ‘average wait time’, your bus should arrive any moment. Or should it?
What if you find out that the person standing next to you at the bus stop has been waiting for the same bus for 10 minutes? Does that change the expected arrival time for the bus? And given that you two have been waiting for different durations, can there be two different expected arrival times for the same bus?
The described bus arrivals (not the real bus arrivals of today) follow a Poisson process, a memoryless stochastic model for a series of discrete events where;
the average time between events is known,
the exact timing of events is random,
the conditional probability distribution of future events is independent of the past.
In other words, they follow a process where things happen randomly and the past doesn’t affect the future. So, your expected wait time for a bus stays 10 minutes, whether you’ve already waited for 3 minutes, or 15 minutes.

The graph above shows an example Poisson process where buses run on average every 10 minutes, and the wait times between buses are modelled by a random variable following an exponential distribution at the rate of 0.1 arrivals per minute (or 6 arrivals per 60 minutes). A Poisson distribution measures the probability of a given number of events happening in a specified time period. For instance, given that buses run every 10 minutes, the probability that there are actually 6 bus arrivals within an hour is 16%.
Poisson distribution function formula
But what does any of this have to do with B2B software, I hear you say?
First, thank you for bearing with me! Second, let’s connect the dots:

Crossing the chasm is a marketing theory developed by Geoffrey Moore that describes the challenges faced by technology startups as they try to move from the early adopter phase to the mainstream market. It is based on the idea that there is a "chasm" between the early adopters of a technology and the mainstream market, and that startups need to develop a specific strategy to "cross" this chasm in order to succeed.
Let’s say that
Every new B2B SaaS category takes on average 2 years to reach the Early Majority of target customers, successfully crossing the chasm.
Within a new category X, Company A was founded in late 2021. And they are thinking, "we've been developing the market for a year, so the category should be 'widely adopted' in about a year's time".
Company B was a first mover and had entered the market in the same geography in late 2019. They have been operating for almost 3 years now, so they're thinking this category is about to reach 'Early Majority'. It's been long "in the making"!
Given different players have been tackling this space for different durations, can there be different expected 'wide adoption' times for the same category in the same geography?
Is the timing of the first movers a good or irrelevant data point for estimating when a category will be widely adopted?
Taking a stab at answering these questions will require assessing whether a Poisson process provides a good representation of customers’ adoption of new B2B SaaS categories.
And, a Poisson process should provide a good representation if the following conditions are met:
Poisson Process Conditions | B2B SaaS categories |
|---|---|
Event occurrences are discrete. | Yes, a new category has either crossed the chasm or not. |
Event occurrences are not simultaneous. | Yes, 2 new categories cannot cross the chasm at exactly the same time (don’t forget that subintervals can be as small as milliseconds). |
The probability of one event occurring in a given time period is proportional to the length of the given time period. | Yes, the longer the time period, the more likely it is for a new category to be adopted. |
Average rate at which events occur is constant. | Yes, Gartner’s “Hype Cycles” suggest that a new technology takes on average 2-5 years to go through the cycle, so thinking that a new B2B SaaS category takes on average 2 years to reach Early Majority is a fair assumption to make. |
Events occur independently, so the occurrence of one event doesn’t affect the probability of any subsequent event. | TL;DR: In some cases. This is the trickiest condition to ‘tick’. In reality, adoption of one technology can very well influence the adoption of another. A very obvious and far-reaching example is the cloud’s crossing of the chasm subsequently enabling the adoption of many B2B SaaS applications. With that being said, I come across many B2B SaaS companies operating in nascent categories, where the synergies with other technologies and that ‘pull’ from the market are not yet palpable. In those early days, moving up the adoption curve demonstrates the characteristics of an ‘independent event’ more often than not. |
We’ve now established how a new B2B SaaS category’s crossing of the chasm resembles a Poisson process! 🤓
And it looks like this:
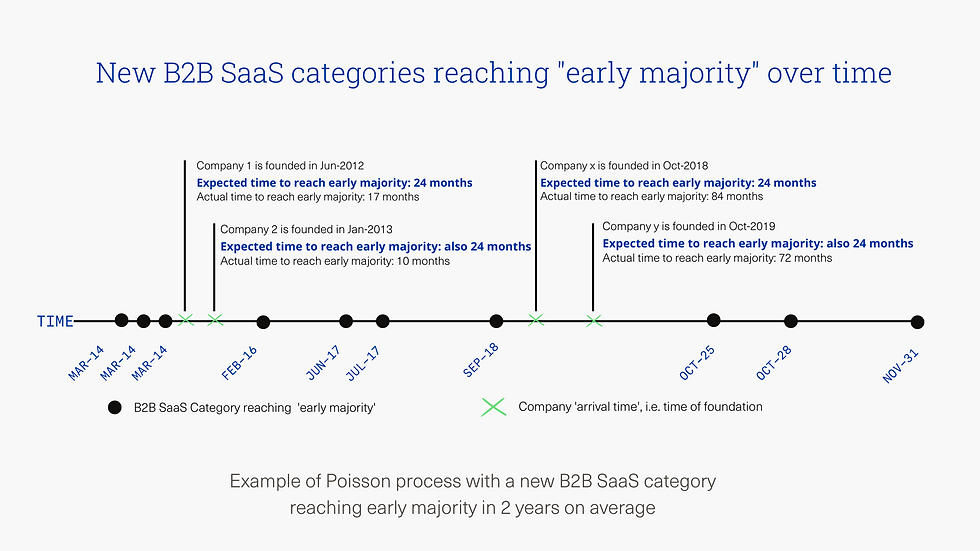
The graph above shows an example Poisson process where new B2B SaaS categories take on average 2 years to reach Early Majority, and the intervals between 2 new categories' 'time of arrival' are modelled by a random variable following an exponential distribution at the rate of 1/24 months.
So, how is this helpful for a company from a strategic or an operational perspective?
Well, in a few ways:
It demonstrates that the timing of the first movers in a new B2B SaaS category is an irrelevant data point for estimating when that category will reach 'Early Majority'.
It tells us, given that there is a new B2B SaaS category crossing the chasm on average in 2 years, the probability that there is actually one that crosses the chasm within 2 years is P(x = 1) =e^(-1)*(1^1)/1! = 37%.
And if you’re finding that
All or almost all sales are greenfield,
Loss reasons are never or very rarely competitors,
You’re spending several months educating customers on the value proposition, ROI, success metrics, etc.
Customers don’t have dedicated team members whose KPIs are directly linked to your product’s value proposition,
You’re speaking to various ‘buyer personas’ at various companies/industries,
Your funnel metrics also seem to be following a ‘Poisson process’, (e.g. average time to sales is x weeks, but those ‘x’ weeks in reality are as random as bus arrival times)
Then, it might be worth looking at your go-to-market (GTM) strategy from the perspective of a company who is operating in a memoryless universe, and whose expected time to cross the chasm is staying constant. How would you structure and grow your GTM or product team if you knew that the past x many years in the market, statistically speaking, didn’t bring you closer to crossing the chasm?
What would you do if you knew the conditional probability of future sales, given historical sales, was the same as if there wasn’t a past. How would you go about turning independent events into dependent events so that your sales are clearly not a Poisson process? In other words, how would you make sure that winning a business as a customer increases the probability of winning another business? For instance, would you prioritise bringing in additional Account Executives with ambitious sales targets to grow the topline, or would you rather invest more heavily in community building and Thought Leadership activities? I’d strongly argue the latter.
Similarly, if you’re finding that
Sales are starting to be a mix of greenfield and replacement,
Sales processes are getting more competitive,
Customers are becoming more sophisticated in their needs and asks, with better defined internal success metrics,
Customers have dedicated team members whose KPIs are directly linked to your product’s value proposition,
‘Buyer personas’ are starting to become more consistent across companies/industries,
Funnel metrics start to become more predictable and representative of a typical sales journey, providing leading indicators of a ‘well-oiled machine’ that is your GTM motion
Then, it might be worth looking at your GTM strategy from the perspective of a company who is no longer in a memoryless universe, no longer in a random walk, and crossing the chasm is getting closer with time. How would you structure and grow your GTM team with this information? Wouldn’t you feel more comfortable investing more heavily in sales & marketing’? I’d strongly argue, yes.
P.S. Calls to a customer support line and visitors to a store are also examples of Poisson processes, so you can optimise the size and schedule of your customer support center or store staff using Poisson distributions.
Intrigued to learn how or find out more about Poisson processes? I highly recommend:
For further information on crossing the chasm:
Appendix


